Predicting Electricity Consumption and Production
Welcome to another blog post about my data analytics journey! Today, I’m going to delve into the world of predictive energy modeling by using the Enefit Energy dataset from Kaggle. This Kaggle competition was one of the most interesting and challenging I’ve done so far. Goal was to predict energy consumption and production for the country of Estonia. Predictions had to be made on an hourly basis for the next 2 days. Many variables were available to come up with a good working model. Examples are the weather forecast, installed solar panel capacity, historical consumption and others.
So, if you are ready, let’s explore the powerful world of energy!
Introduction
It is has become increasingly important for energy companies to predict energy consumption and production on any given day. Here are several key reasons:
1. Balancing Supply and Demand: Energy supply must match with demand to make the system reliable and avoid outages. Accurate predictions help manage the generation and supply of energy. For example, during peak demand, additional resources are activated, but in low demand, there is a saving in resources and costs.
2. Integrating Renewable Energy Sources: As more renewable energy sources like wind and solar are integrated into the energy grid, predicting energy production becomes more complex. Accurate forecasting helps in planning the necessary backup from more controllable power sources like natural gas or hydroelectric power.
3. Grid Stability and Reliability: Predicting consumption patterns and production levels are crucial for maintaining grid stability. Sudden changes in energy demand or supply can lead to grid instability and even failures. Predictive analytics help reduce these risks by providing advanced warnings and allowing for proactive adjustments.
4. Operational Efficiency: By predicting when energy usage will be high or low, companies can optimize their operations, reduce waste, and lower costs. This includes more strategic purchasing of fuel and better maintenance scheduling.
5. Economic Planning: For energy companies, being able to forecast energy trends accurately is crucial for economic planning and investment decisions. This includes deciding where and when to build new infrastructure or expand existing capabilities.
6. Market Pricing: Energy pricing can fluctuate based on supply and demand dynamics. Accurate predictions allow companies to optimize their pricing strategies, potentially leading to better profitability or market share.
Overall, the ability to predict energy consumption and production with high accuracy allows companies to respond better to market demands, integrate renewable energy sources more effectively, maintain grid stability, and optimize economic outcomes.
Exploring the Dataset
The dataset consists of several .csv files like electricity & gas prices, clients, weather forecast (3.5 million records), historical weather, regions with weather stations and a training file (over 2 million records).
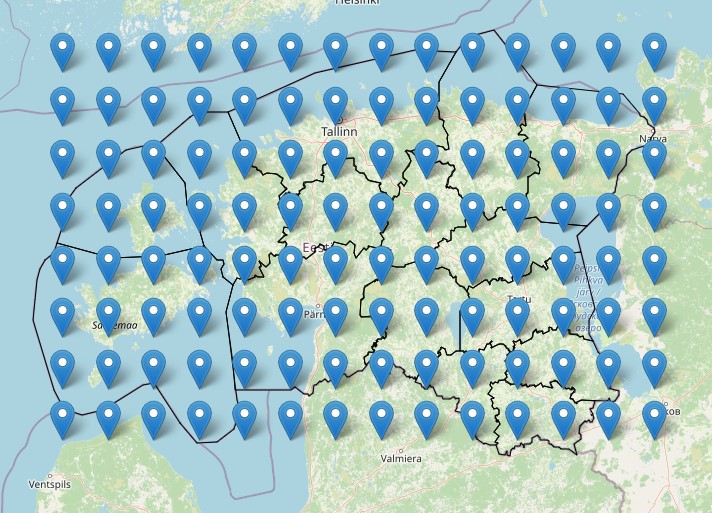
The forecast weather is an historical file of weather forecasts over the last 1,5 years. It contains 3,5 million records with data of 112 GPS areas, each with 1 prediction per hour, each 1,2,3,4…48 hours ahead. Elements recorded are:
latitude,longitude,origin_datetime,hours_ahead,temperature,dewpoint,cloudcover_high,cloudcover_low,cloudcover_mid,cloudcover_total,10_metre_u_wind_component,10_metre_v_wind_component,data_block_id,forecast_datetime,direct_solar_radiation,surface_solar_radiation_downwards,snowfall,total_precipitation
Historical weather has the same type of information, but holds the actual weather and not the forecast.
Another crucial source of information is the client file. I won’t go into too much detail, but it became very important to categorize customers based on product (contract) type, county, whether the client is a business or not, and the available solar power capacity.
During this exploration phase I did some checks to see if I understood the data correctly and if there are any obvious pitfalls I could detect right from the start.
Position of the weather stations over Estonia
Relationships between variables
I did some checks to understand the relationship of certain variables to another variable. Noteworthy ones I can mention here are:
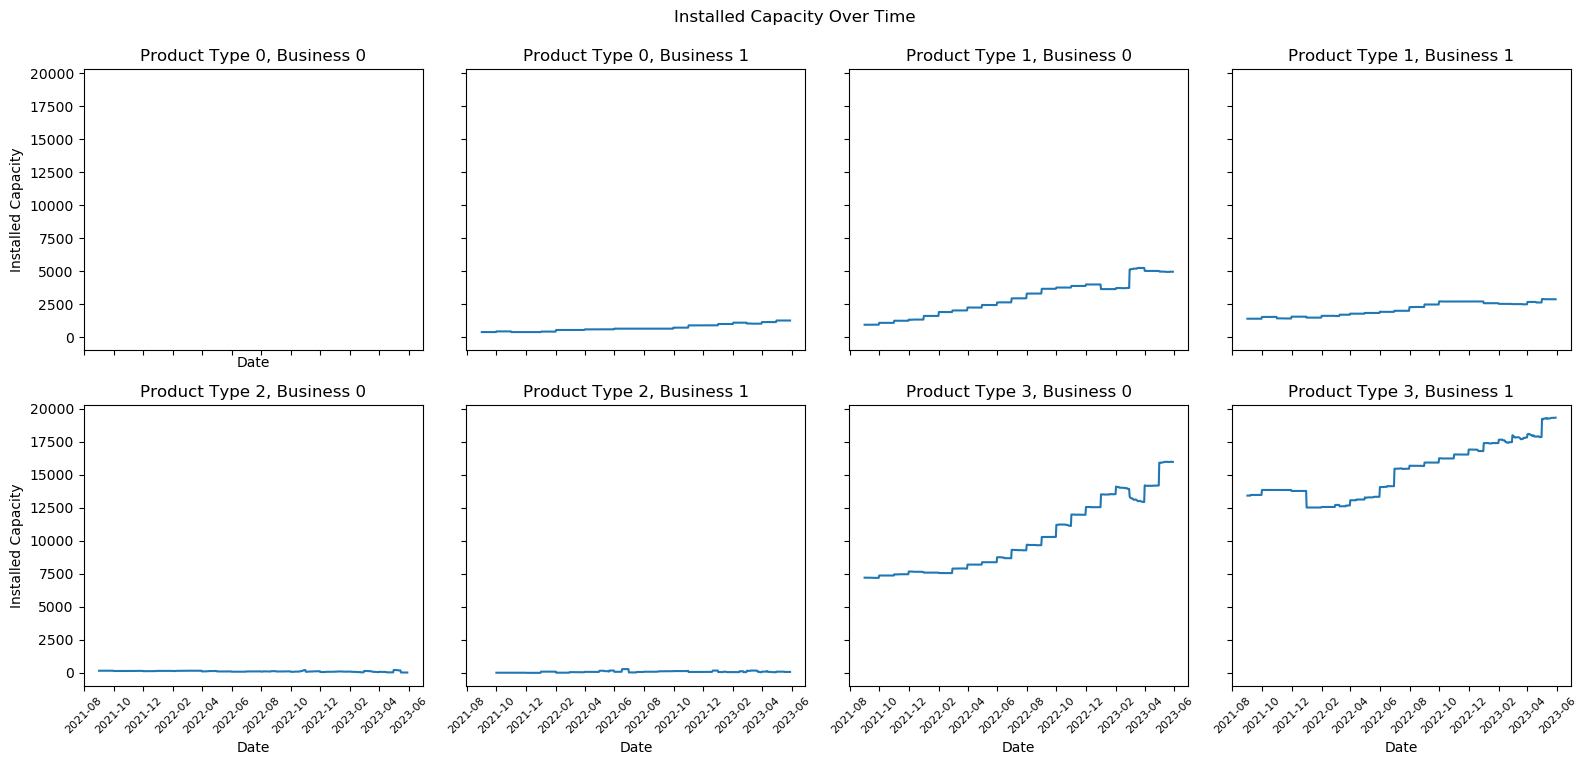
- Energy Capacity over time: The plot I created here shows the growth of energy capacity, related to Product or Contract Type and Business/Household combitions.
The visual shows a clear capacity growth, specifically for Product Type 1 and 3.
Product (Contract) Type: 0: “Combined”, 1: “Fixed”, 2: “General service”, 3: “Spot”
Next relationship I investigated was between the weather components and the variable that I needed to predict (production and consumption).
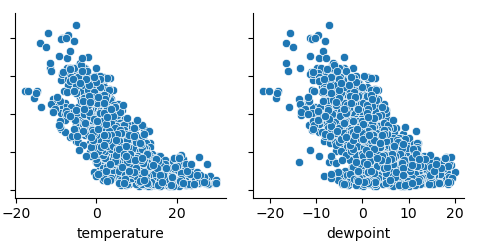
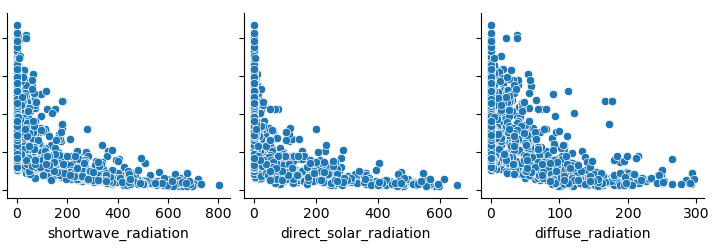
- Relevant weather components related to power consumption: In the plots below I show the most relevant attributes of the weather forecast when it comes to energy consumption. It is clear that energy consumption declines when the temperature rises. And we can also conclude that there is a negative correlation between energy consumption and the amount of radiation (sunlight).
Weather elements that influence energy consumption.
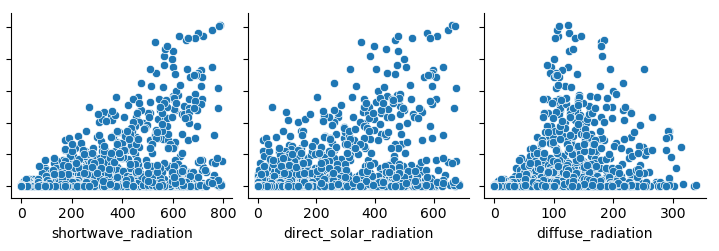
I also investigated the influence of weather on energy production.
- Relevant weather components related to power production: In the plots below we see the opposite effect when compared to power consumption. When there is more radiation (sunlight) there is more energy production. This is a possitive correlation. We can also see that most energy is produced between 10 hrs am and 17 hrs pm. That makes sense, but it is nice to see that the data backs up this ‘no brainer’. Another positive correlation is seen at the installed capacity. More capacity means more production. Another ‘no brainer’. Final plot shows the relationship with temperature. Cold temperatures mean less production, and temperatures between 5-15 degrees the highest. After 15 degress there is no further increase.
Preprocessing of the Data
Preprocessing of data is a vital step in every Data Science project. Most datasets are far from perfect and need to undergo vital steps for it to serve as input to a Machine Learning Model.
The steps I took in this Energy dataset were:
1. Handling Missing Values
One of the initial challenges in any data science project is dealing with missing values. In my case there weren’t many so I won’t go into that.
2. Checking for Outliers
Outliers can significantly impact the performance of predictive models. I utilized the same pairplot techniques (see above) and Z-score analysis to identify and remove outliers from the data. As it turned out only the electricity prices had some significant outliers. These outliers were removed and filled with the same price as a previous meaningful price point.
3. Encoding Cat. Variables
Categorical variables need to be encoded into a numerical format before feeding them into machine learning models. I did not have to do any encoding to this data.
Building the Machine Learning Models
After completing the pre-processing steps, it is time to create the Machine Learning model. The challenge is to predict energy consumption and production. These two variables can take on pretty much any value, so we consider the predictions to be ‘continuous’ (as opposed to for example predicting a fixed outcome of ‘yes or no’, ‘true or false’ etc.).
I decided to build different types of ML models for Energy Production and Energy Consumption.
1. A model that predicts Energy Production
I evaluated 6 different models, suitable for predicting continous variables. The models are: LightGBM, XGBoost, CatBoost, Random Forest, AdaBoost, Decision Trees.
The outcome:
Training and evaluating LightGBM…
Mean Squared Error: 9846.536495704782
Mean Absolute Error: 25.022088199724102
Training and evaluating XGBoost…
Mean Squared Error: 10593.784468962709
Mean Absolute Error: 25.470343101038633
Training and evaluating CatBoost…
Mean Squared Error: 8252.14802273349
Mean Absolute Error: 23.15684970360955
Training and evaluating Random Forest…
Mean Squared Error: 11256.553856624487
Mean Absolute Error: 23.881381789537063
Training and evaluating AdaBoost…
Mean Squared Error: 78885.39620655986
Mean Absolute Error: 171.638968077889
Training and evaluating Decision Trees…
Mean Squared Error: 20994.16420299445
Mean Absolute Error: 32.875448153599145
Model of Choice: CatBoost
Feature Importance CatBoost
Understanding which features contribute the most to my CatBoost’s predictions is crucial for making informed decisions. The outcome of such analysis is depicted in the plot below. With this information I can take the most important features and neglect less importance features to improve the model even more.

This plot displays the most important features (columns). Those are the installed capacity, solar power (radiation), eic_count (count of energy production sources), temperature and several others.
2. A model that predicts Energy Consumption
For the Energy Consumption part I went for the Gradient Boosting Model. This model performed best in my tests.
Model of Choice: Gradient Boosting Model
Feature Importance Gradient Boosting
For Energy Consumption I found that the most important features were: temperature, working day and hour of the day.
I created 69 Gradient Boosting Models
For each County / Business-Household & Product or Contract type I created different models, all with the same parameters but trained on different data. This resulted in 69 model, tailored to each possible consumption scenario.
Making Predictions
With my code and models, I’ve made predictions on new unseen data generated in the Kaggle competition. I’m excited to see how my model performs against other competitors and contribute to the advancement of predictive modelling in the energy world.
Stay tuned for updates on my model’s performance and further insights from the competition!
Key Take Aways
The predictive energy modeling project using the Enefit Energy dataset provided several key insights:
- Accuracy: Accurate predictions of energy consumption and production are crucial for balancing supply and demand, integrating renewables, maintaining grid stability, and optimizing operations.
- Key Relationships: Energy consumption declines with higher temperatures and lower radiation, while energy production increases with higher radiation and optimal temperatures.
- Data Preprocessing: Effective preprocessing, such as handling missing values and removing outliers, is vital for reliable model input.
- Model Performance: CatBoost was the best model for predicting energy production, whereas Gradient Boosting was best for consumption predictions.
- Feature Importance: Installed capacity, solar radiation, and temperature were crucial for production predictions, while temperature, working day, and time of day were key for consumption.
- Customized Models: Creating 69 distinct models for different scenarios improved prediction accuracy.
- Implications: These models can significantly improve energy management, resource allocation, and grid reliability.
The entire code
Check out all of the code of this project on Github: Nick Analytics – Predictive Energy Model


