My Power BI Dashboard
Welcome to this new post about my Data Analytics journey.
When I studied Data Science at Datacamp, one of the exam assignments was to create a Power BI Dashboard. The Dashboard should give clear insights in the Logistics and Sales of a company called Pens & Printers. This national office supplies chain experienced significant sales discrepancies across their four regional warehouses—East, West, South, and Central. I knew I had a challenge on my hands…
The company was struggling with large amounts of unsold stock and needed to identify underperforming products and uncover regional sales patterns to optimize inventory and boost overall profitability.
I created a very nice Power BI Dashboard with multiple tabs to showcase my skills, and to provide upper management with an analysis and building blocks to adjust its strategy.
Link to my Dashboard: Nick Analytics Power BI Dashboard
Analysis & Recommendations
During my analysis I defined 3 business goals that should serve as a foundation for change.
1. Minimizing Unsold Stock
My primary goal was to ensure that no stock was older than 3 months. The findings were alarming: numerous items had remained unsold beyond this period.
My Recommendations:
- Stop stocking high-risk, high-value items like Copier Machines and Tables.
- Initiate a 20% discount sale on unsold items to free up warehouse space and capital.
- Fulfill orders from a shared inventory pool across all warehouses to balance stock levels.
2. Balancing Sales Across Regions
Another crucial goal was to ensure sales across all locations were well-balanced, with a maximum of 10% difference between region/subcategory combinations. The data revealed that the West region significantly outperformed the South in all subcategories.
My Recommendations:
- Close the South warehouse and redistribute its inventory to other regions to achieve a better balance.
3. Maintaining a Healthy Profit Margin
The final goal was to maintain a gross profit margin of 25%. However, the current gross profit margin was only 10%.
Recommendations:
- Restrict discounts to manage profit margins more effectively.
- Implement a maximum 20% discount only when upselling (e.g., buy 2, get 1 at 20% off).
- Consider discontinuing Tables or the entire Furniture category from the catalog.
Data Visualization: The Road to Insights
1. Identifying Unsold Stock
Using Power BI, I visualized the recency of sales across regions. This visualization highlighted products that had not been sold within the last 90 days, revealing the extent of unsold inventory in each warehouse.
Key Insight: The South region had the highest unsold stock value, indicating significant inefficiencies in inventory management.
2. Sales Performance by Region and Category
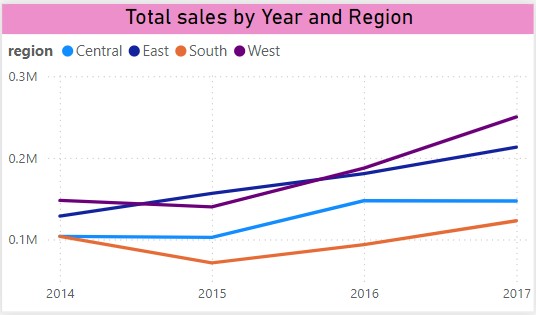
Next, I examined total sales and profit margins across the regions. By plotting sales data over four years (2014-2017), I identified trends and disparities in performance.
Key Insight: The West region consistently outperformed other regions in sales, while the South lagged behind. This confirmed the need for redistributing inventory.
3. Profit Margin Analysis
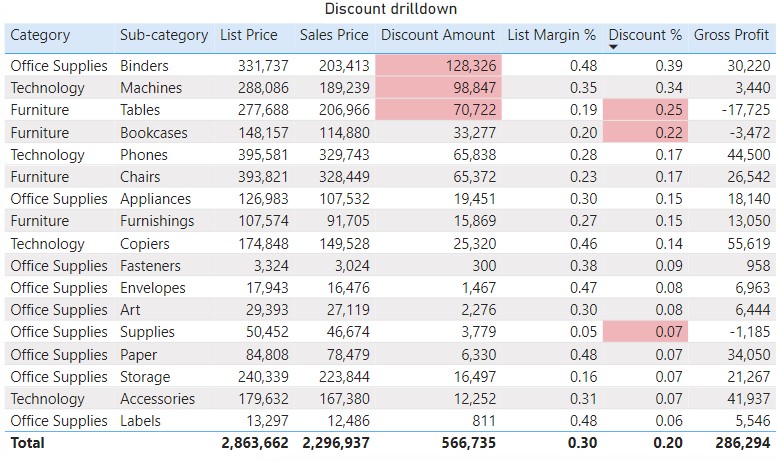
To address the low profit margins, I analyzed the impact of discounts on profitability. A table of discounts versus profit margins across different categories provided clarity.
Key Insight: Excessive discounts were eroding profit margins, especially in high-ticket items like Furniture and Technology. This supported my recommendation to restrict discounts and manage them more strategically.
4. Product and Sub-Category Performance
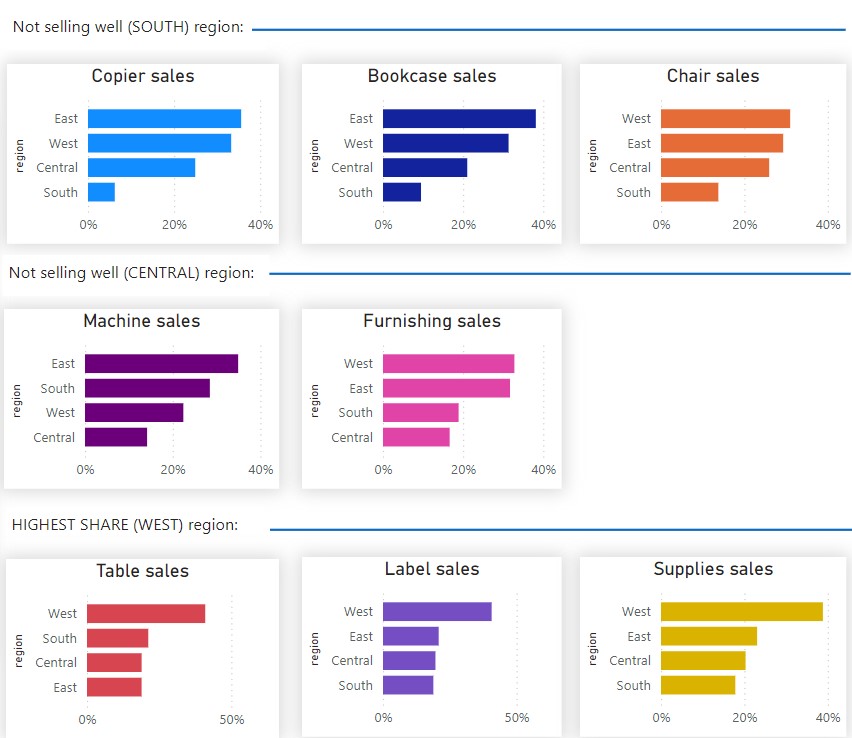
I created detailed bar charts to display sales performance across various sub-categories. This helped pinpoint underperforming products.
Key Insight: The South is lagging in all categories
5. Reordering Frequency and Stock Management
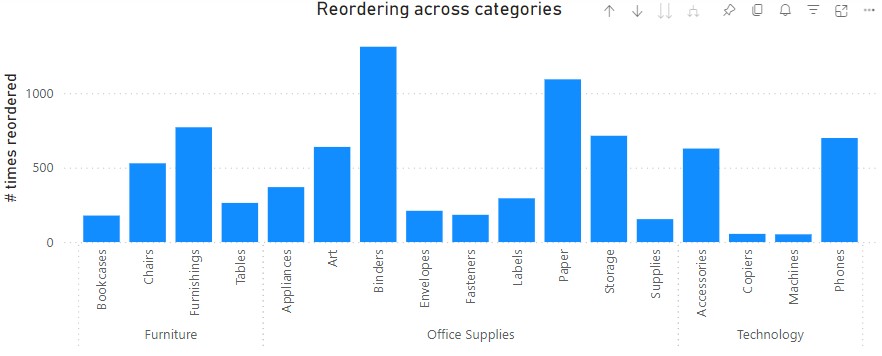
I analyzed the reordering frequency of products across different categories to identify inefficiencies in stock management. By examining which products required frequent reordering, I could pinpoint areas where stock management could be optimized.

Key Insight: The Office Supply category, particularly products like Binders and Papers, showed the highest reordering frequency, indicating a strong and consistent demand. Conversely, Technology items such as Copiers and Machines had the lowest reordering rates, suggesting overstocking risks. This insight underscores the need for more dynamic inventory management, focusing on maintaining optimal stock levels for high-demand items while reducing excess inventory of low-demand products.
Check out my dashboard
My dashboard can be found on this link: Nick Analytics Power BI Dashboard or press the button:
Conclusion: Data-Driven Decisions for Future Success
By diving deep into sales data and creating powerful visualizations, I was able to identify critical issues affecting the Pens & Printers company. My recommendations, backed by clear insights from Power BI visualizations, provide a roadmap for improving inventory management, balancing regional sales, and enhancing profitability.
Next Steps:
- Implement a strategic discount policy: Manage unsold stock and improve profit margins by being more selective with discounts.
- Optimize the distribution network: Close underperforming warehouses (like South) and redistribute inventory.
- Monitor sales performance: Continuously track sales data across regions to ensure balanced growth.
With these data-driven strategies and actionable insights, this company will be better equipped to streamline operations and achieve their business goals.
Thanks for reading my blog.


