Boston Marathon ’22 & ’23 Facts
Welcome to this new post about my Data Analytics journey.
As a passionate runner myself, I’m always interested in knowing more about the marathon and in particular the data analysis part of it. So, I decided to look around on the internet to see if there are interesting datasets about this epic distance and its participants. I checked out the ‘big five’ events and came across the Boston Marathon. This well known marathon publishes a lot of data about its participants like age, gender and lots of checkpoint data along the route. So, for me a true treasure trove to get my hands on.
I downloaded the 2022 and 2023 versions and had a great time analyzing all the ins and outs of these datasets. I cleaned them, added features, removed outliers and took the time to see if there are interesting statistical facts to be discovered. I also took it to the next level trying to predict each runner’s finish time during the course of the race. I put this part in a separate blog called …
So, if you are ready to learn more, read on and enjoy my findings.
The dataset (2022 and 2023)
I could not download the data in one go, so I had to do it gradually and ended up with about 200 csv files (100 for each year). It contained details about some 25.000 runners for each marathon. Most important elements for me were:
– Bib number – the unique identification runners wear on their shirt
– Runner age
– Runner gender
– Passing times at 5k, 10k, 15k, 20k, Half way, 25k, 30k, 35k, 40k, Finish
The pre-processing steps
Diagram
I created a diagram to illustrate the steps I took in the first phase of pre-processing the data.
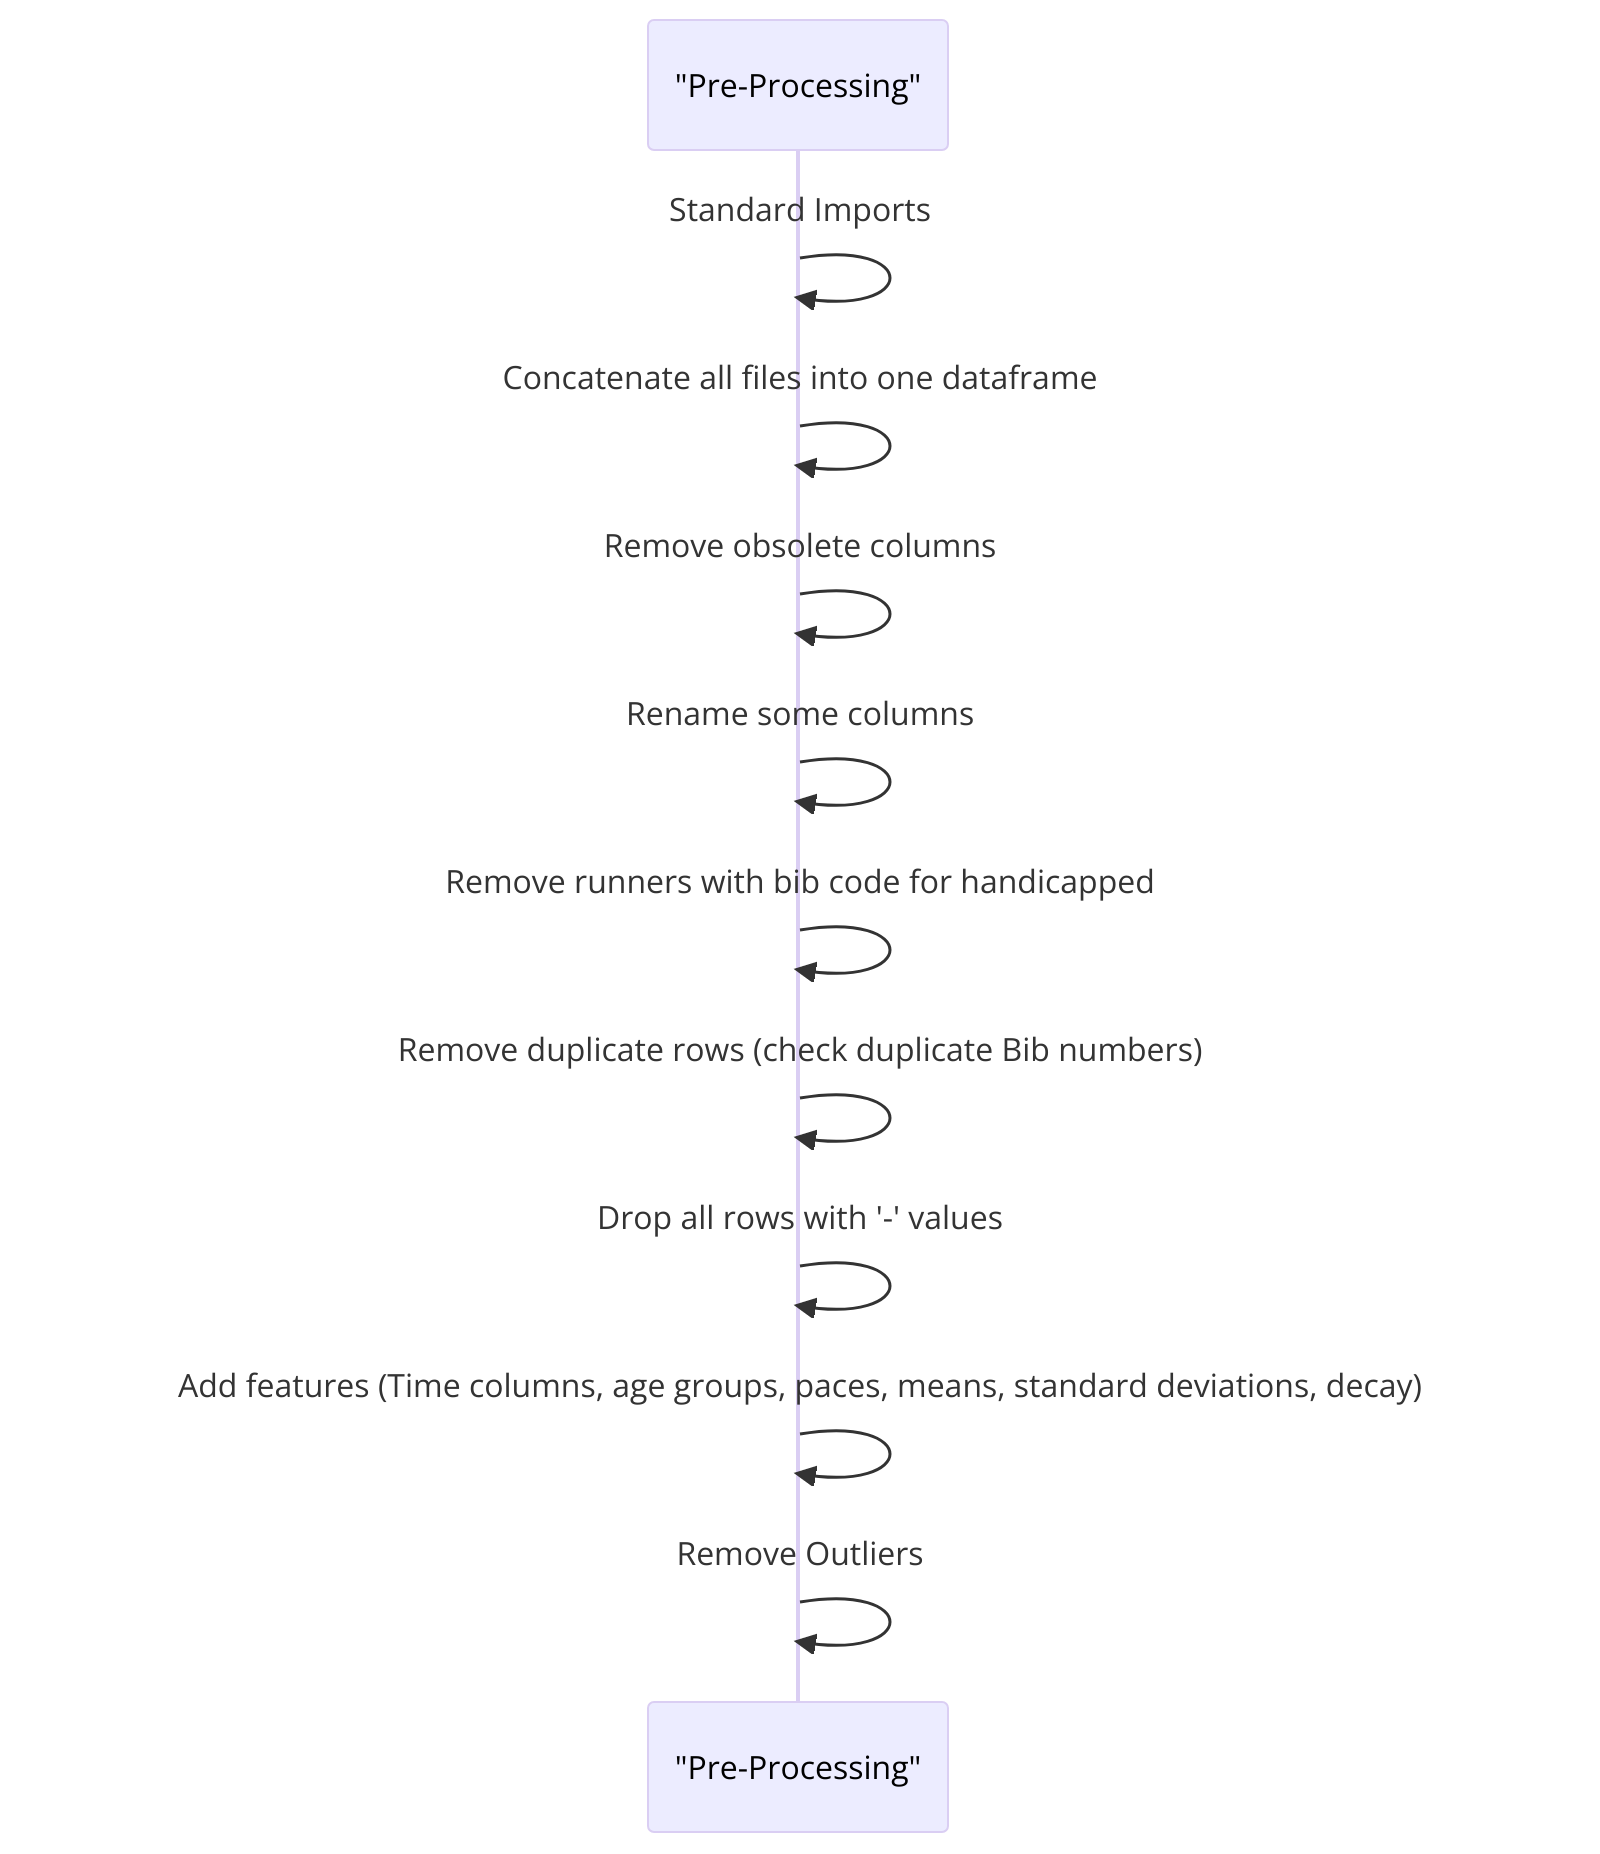
Overview of the pre-processing steps. I handled each year separately because the two Boston Marathons are unique. I had to remove some rows (runners) because of missing checkpoints. Outliers were also removed and a some very important features were added.
Adding features to the data
After the pre-processing steps I decided to add some new features to the data. I can use those for statistical purposes but also to enhance my machine learning model that will prevent finish times (see next blog).
Features (columns) that I added to the data are:
– Average Pace between each checkpoint
– Percentage decay between each checkpoint
I wanted to get an idea of how a runner is doing during the race. Is he/she losing pace or running a ‘flat’ race. And on average what pace did we see at each passing point. These kind of questions can give insights in how – on average – the runners build up their race. The result can help runners improve their training and compare their performance with others. Another interesting aspect would be to compare the Boston Marathon with other marathons in terms of how easy or hard this run is.
Now let’s go to the statistics !
Statistical Analysis
I did some very interesting analysis’ with the Boston Marathon Data. Some of my findings speak for itself, so I won’t comment on those too much. At the more complicated ones I’ll add an explanation.
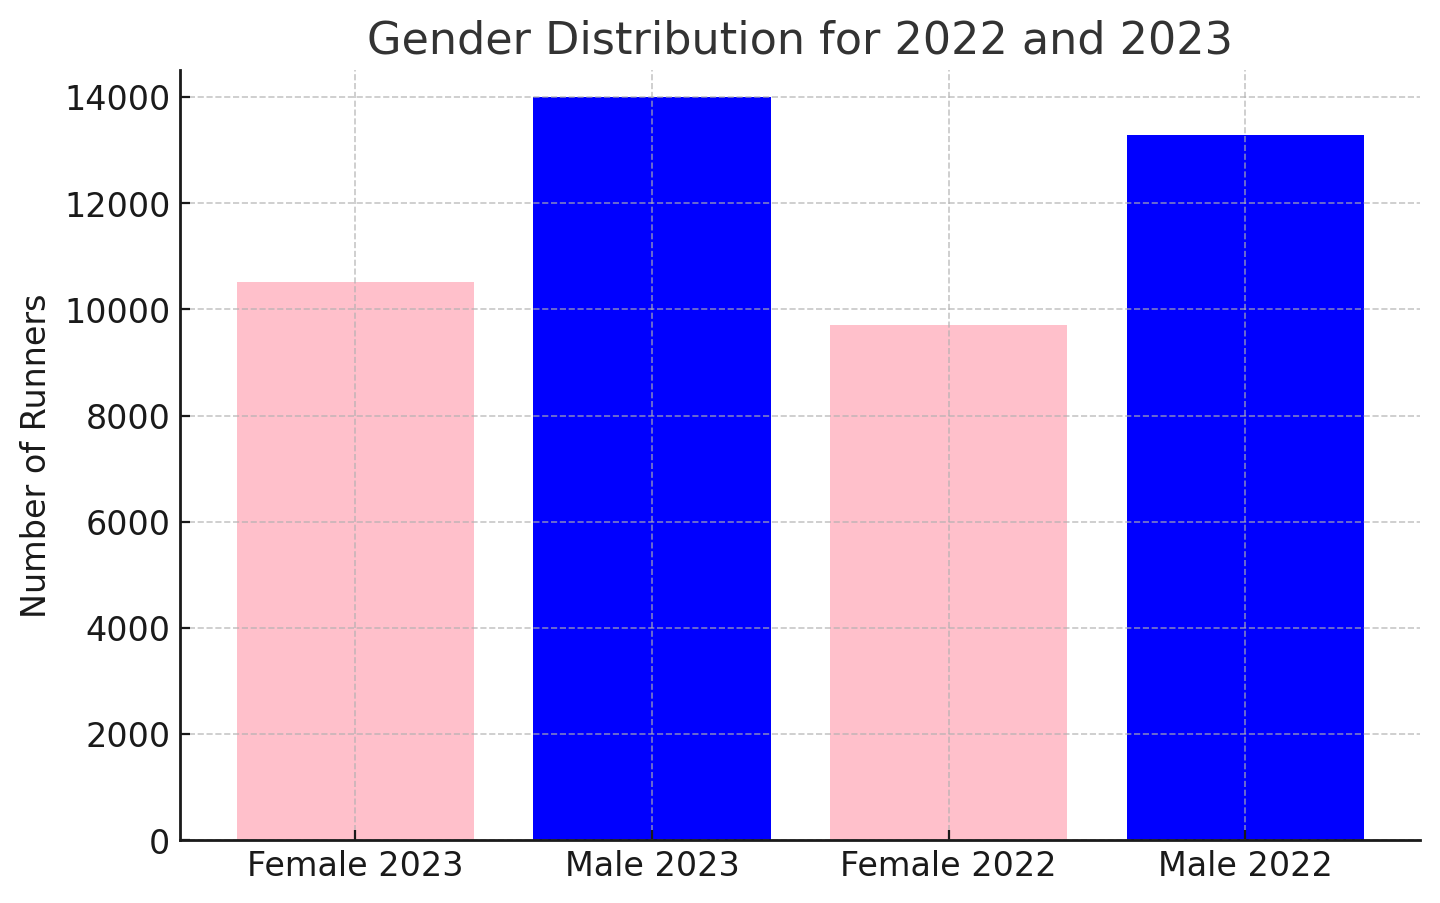
1. Male vs. Female participants
- 2023: 10,517 females and 14,003 males participated.
- 2022: 9,706 females and 13,283 males participated.
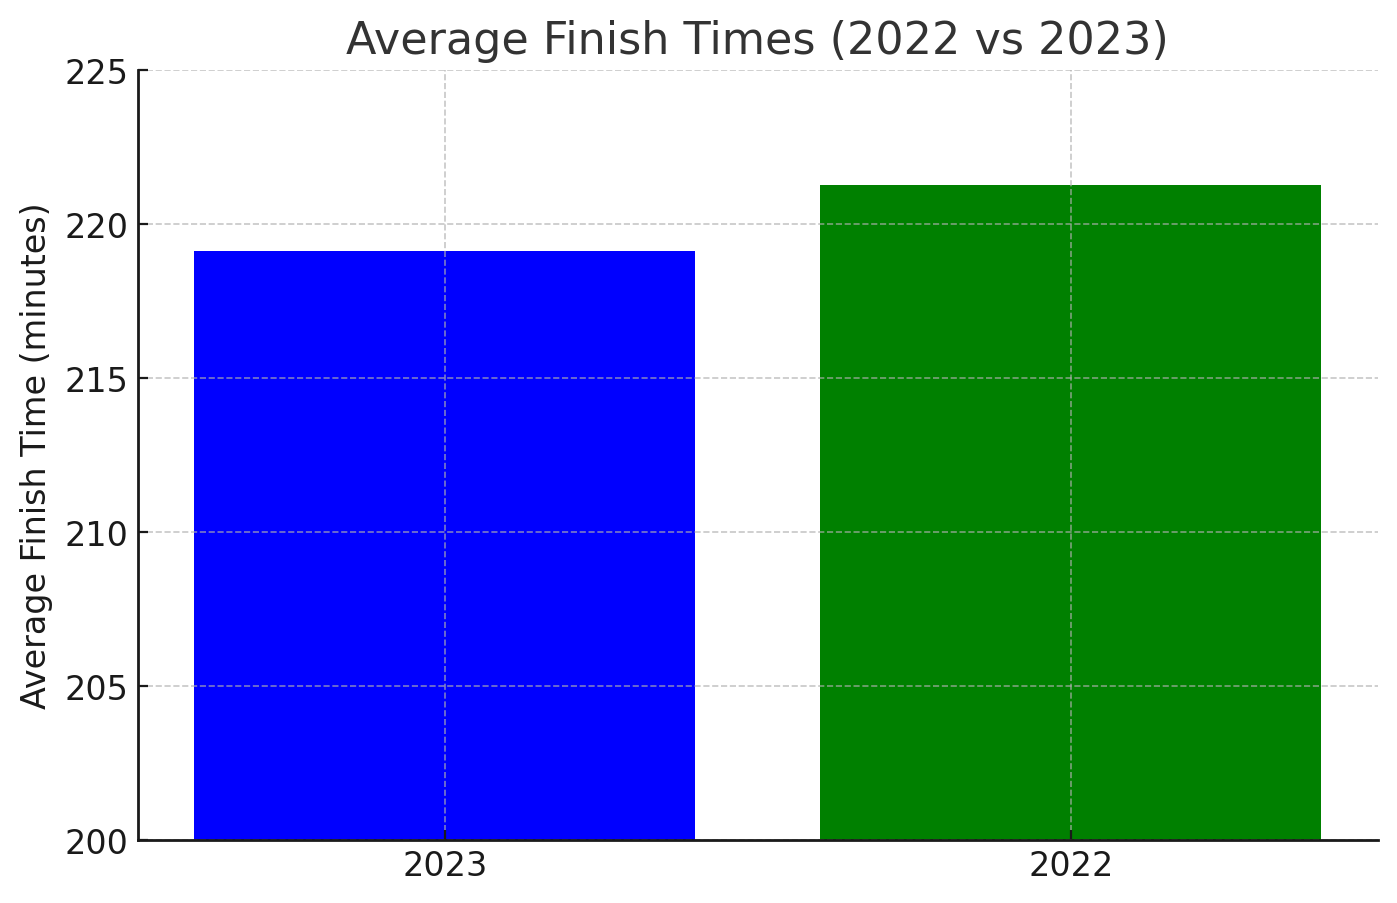
2. Average finish times for all runners
It looks like 2023 was a bit faster on average.
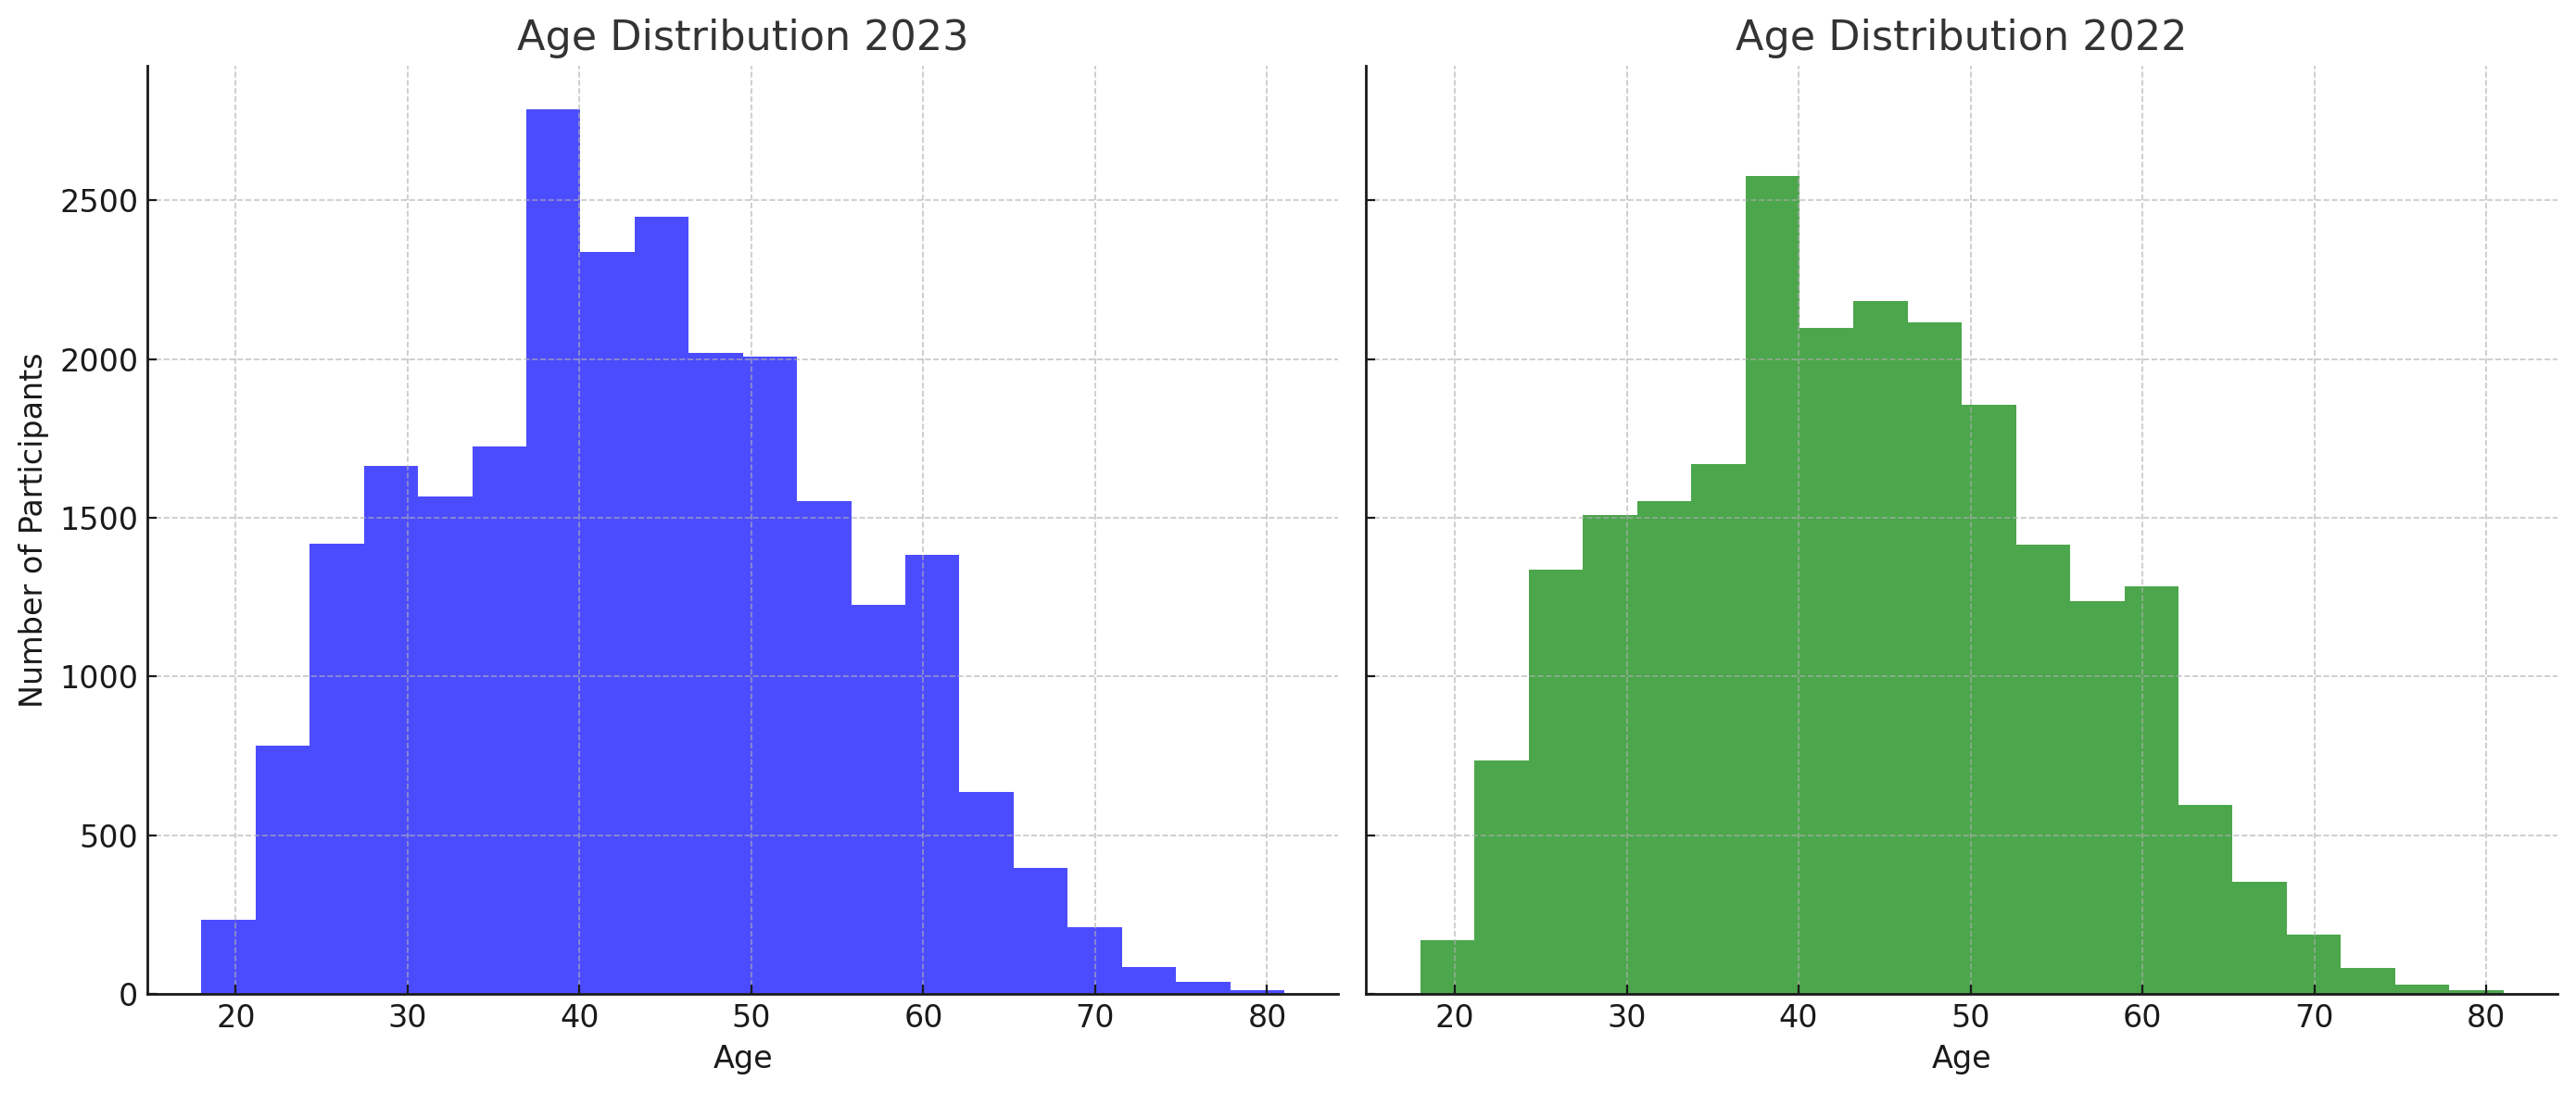
3. Age Distribution (males and females)
2022 and 2023 show very similar age distributions. Both years have peak participant counts in the age groups around the mid-40s, with a broad spread from young adults to seniors.
4. Distribution of Finish times per gender (2022)
Interesting insight on the distribution of finish times per gender. Mean finish time for all runners is 03:41:15 hrs.
5. Pace comparison
In my case ‘pace’ is defined as the speed per km.
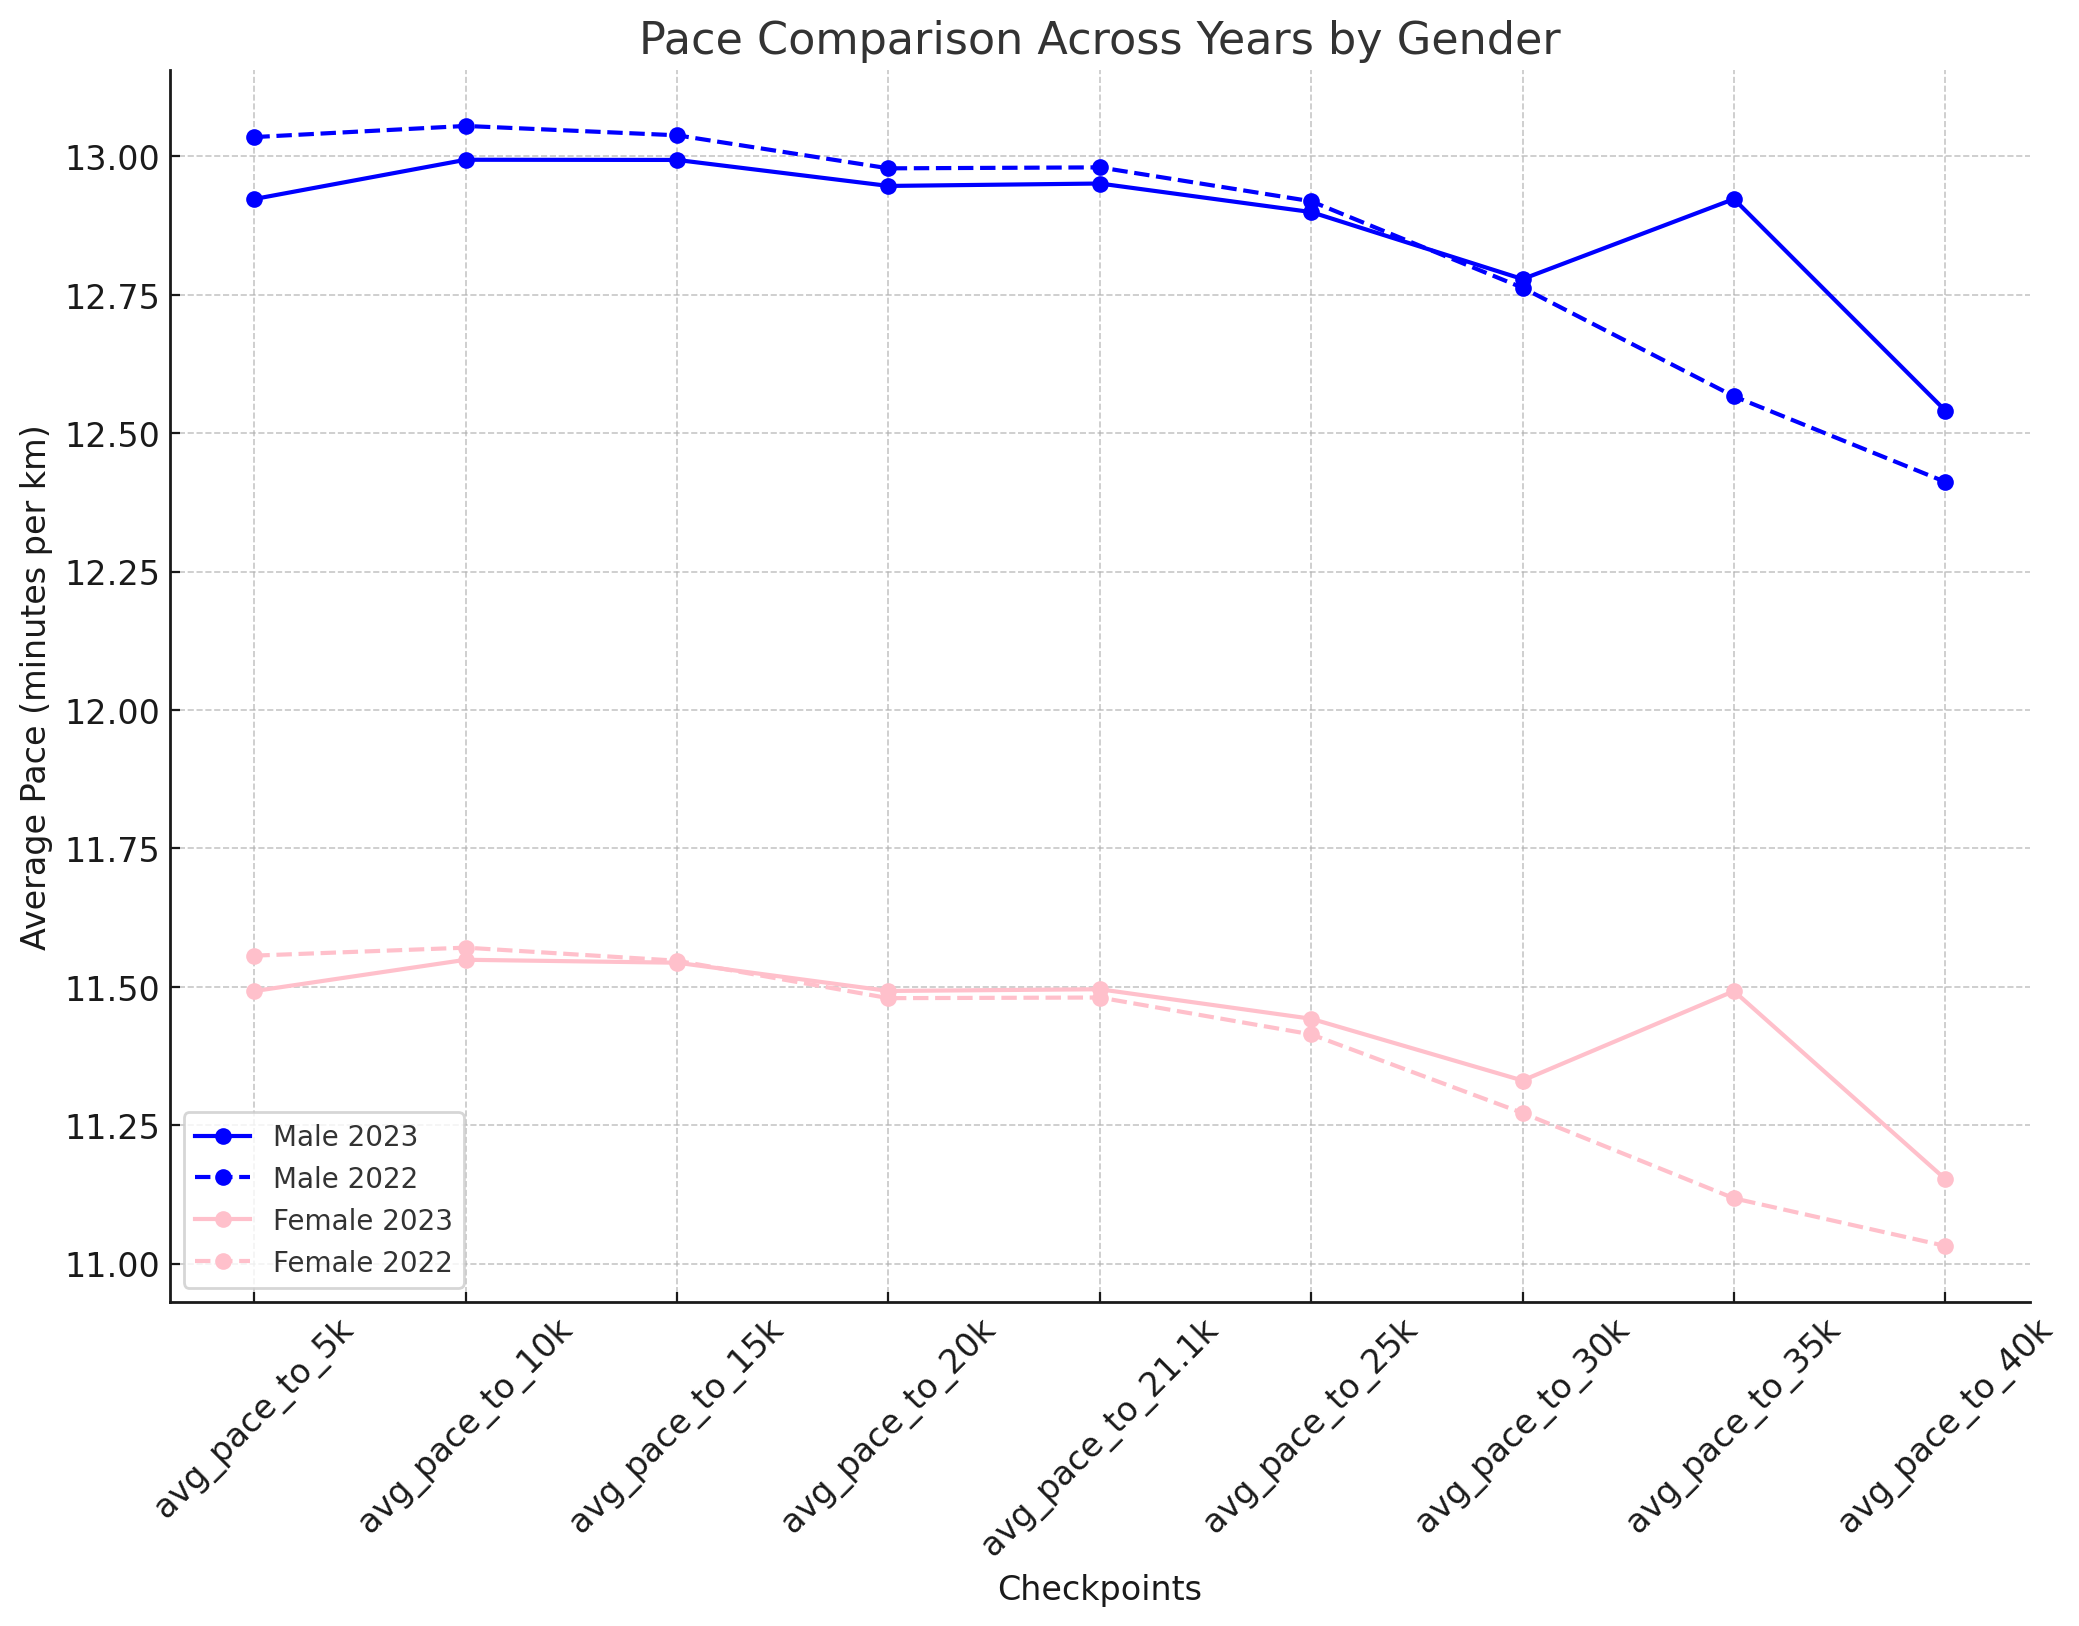
The 2 years show similar results with paces for men around 12.50 to 13.00 km/hr and for women 11.50 to 11.00 km/hr. Near the 25k mark speed in 2023 crosses 2022 to the upside. The sudden peak at 35k in 2023 is not something I can explain. I know that there is a strong descent from 33k to 38k. Maybe due to the weather conditions or the course itself it lead to faster paces.
6. Mean Pace at Checkpoints (all runners)
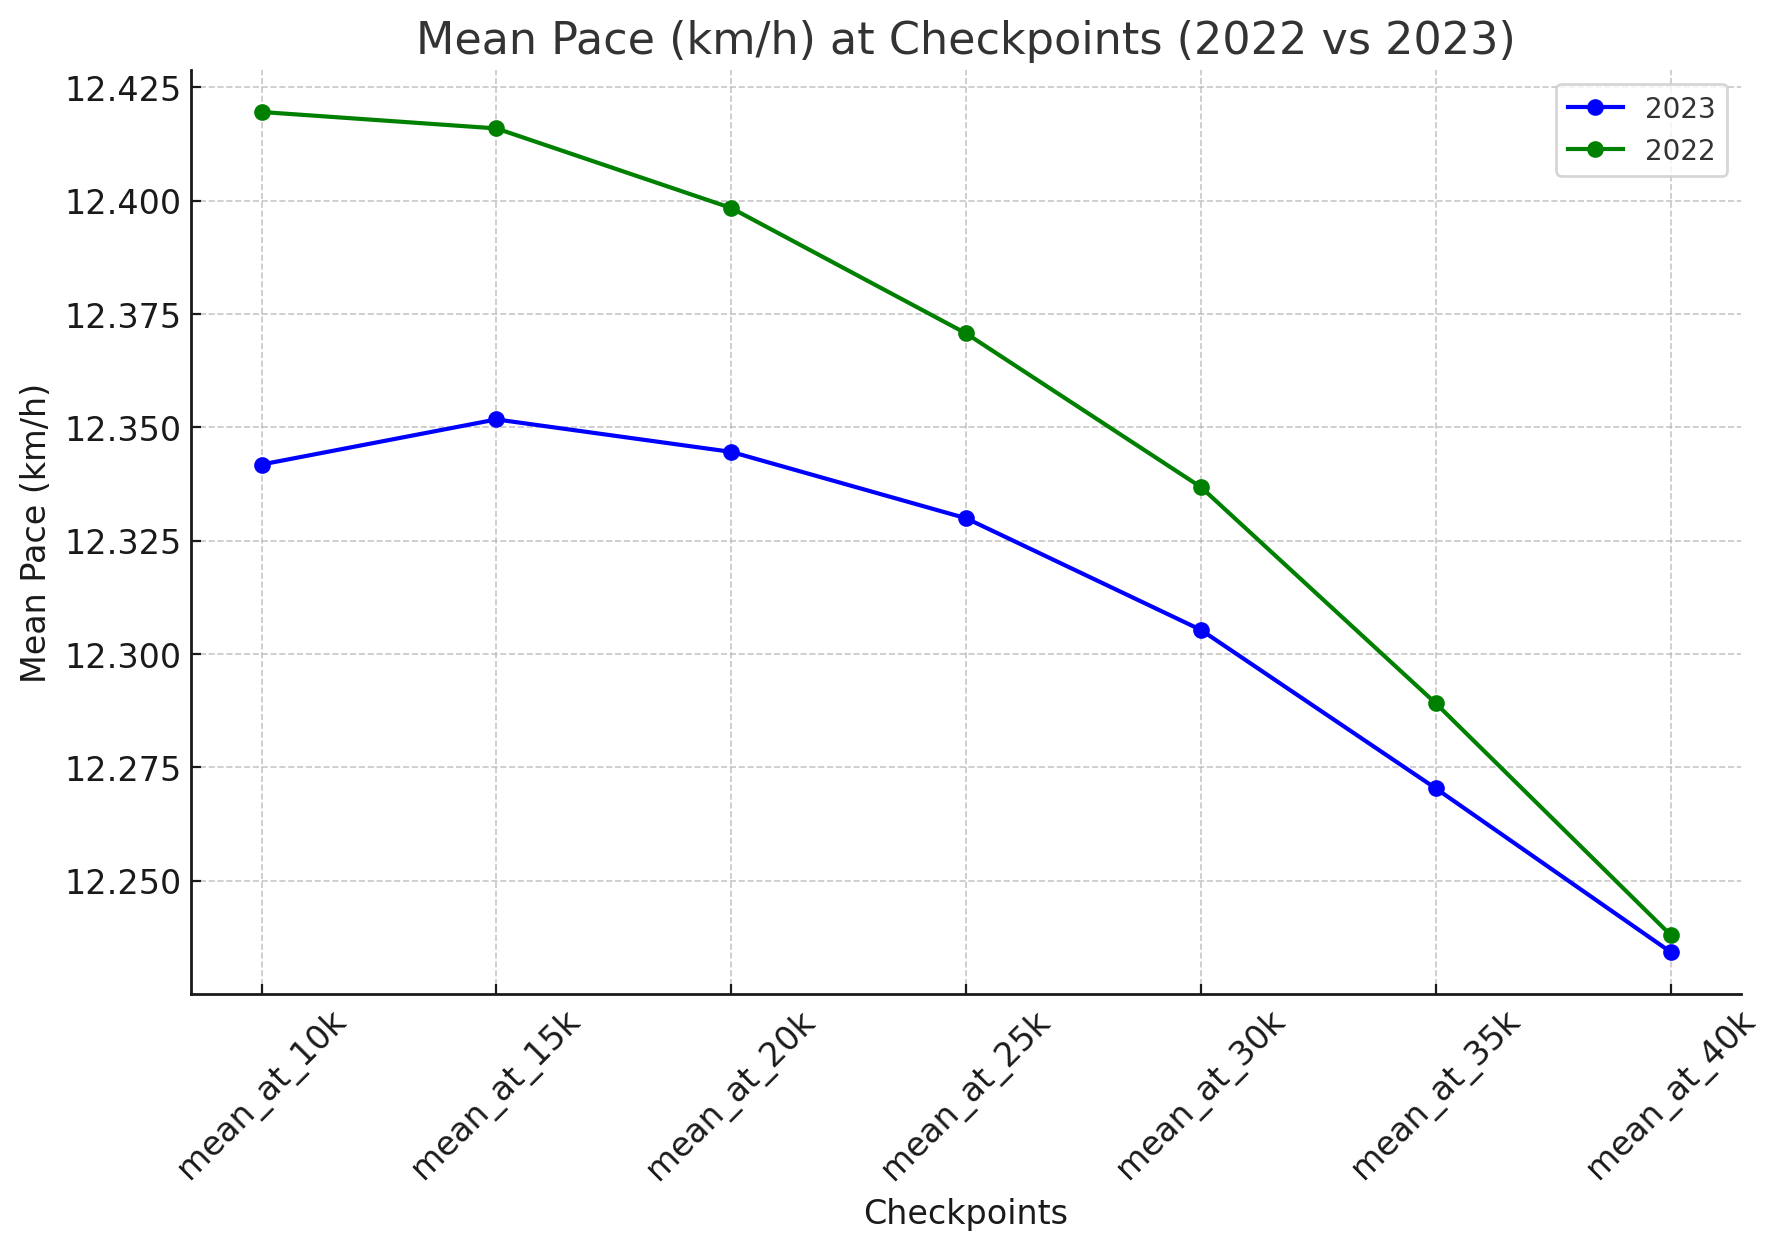
This is the average pace decline over both years for all runners.
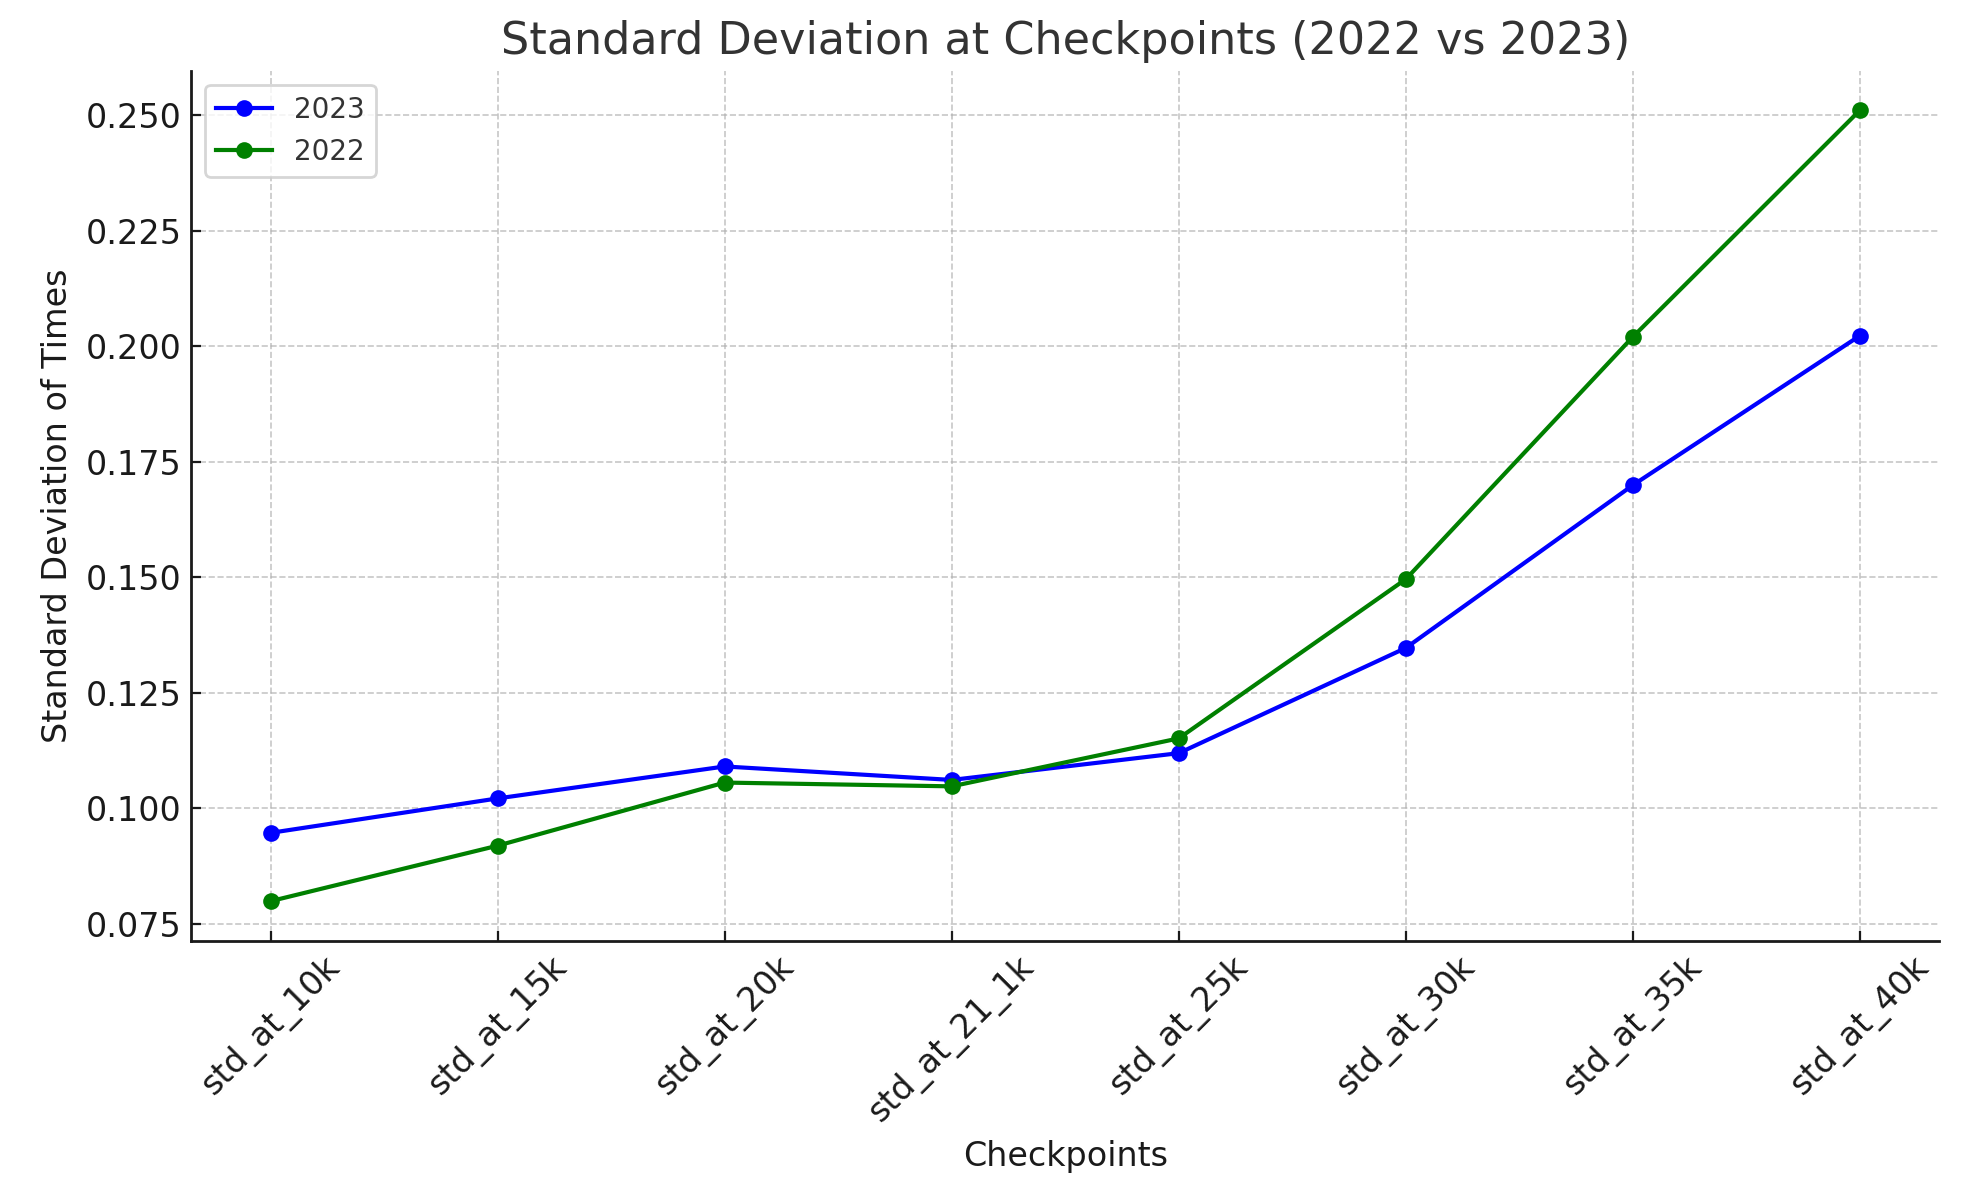
7. Std Pace at Checkpoints
The standard deviation of finish times at various checkpoints indicates the variability of runner performance at those points. For 2023, the variability (standard deviation) tends to be lower at earlier checkpoints and increases towards the end, suggesting more divergence in performance as the race progresses. This pattern is similar in 2022, but the increase in variability is more pronounced, especially towards the 40k mark.
8. Which runners ran a perfectly ‘flat’ race
There are runners that can keep the same pace during the entire marathon. It is truly amazing that some only deviate 1 second on average between all checkpoints. I created a top 10 list of runners in 2023 with their performance. Note: those runners are not necessarily the top ranking athletes, but they just walk ‘machines’.

The first runner on average deviated less than 1 second at each checkpoint and on the finish line. Truly amazing ! ![]()
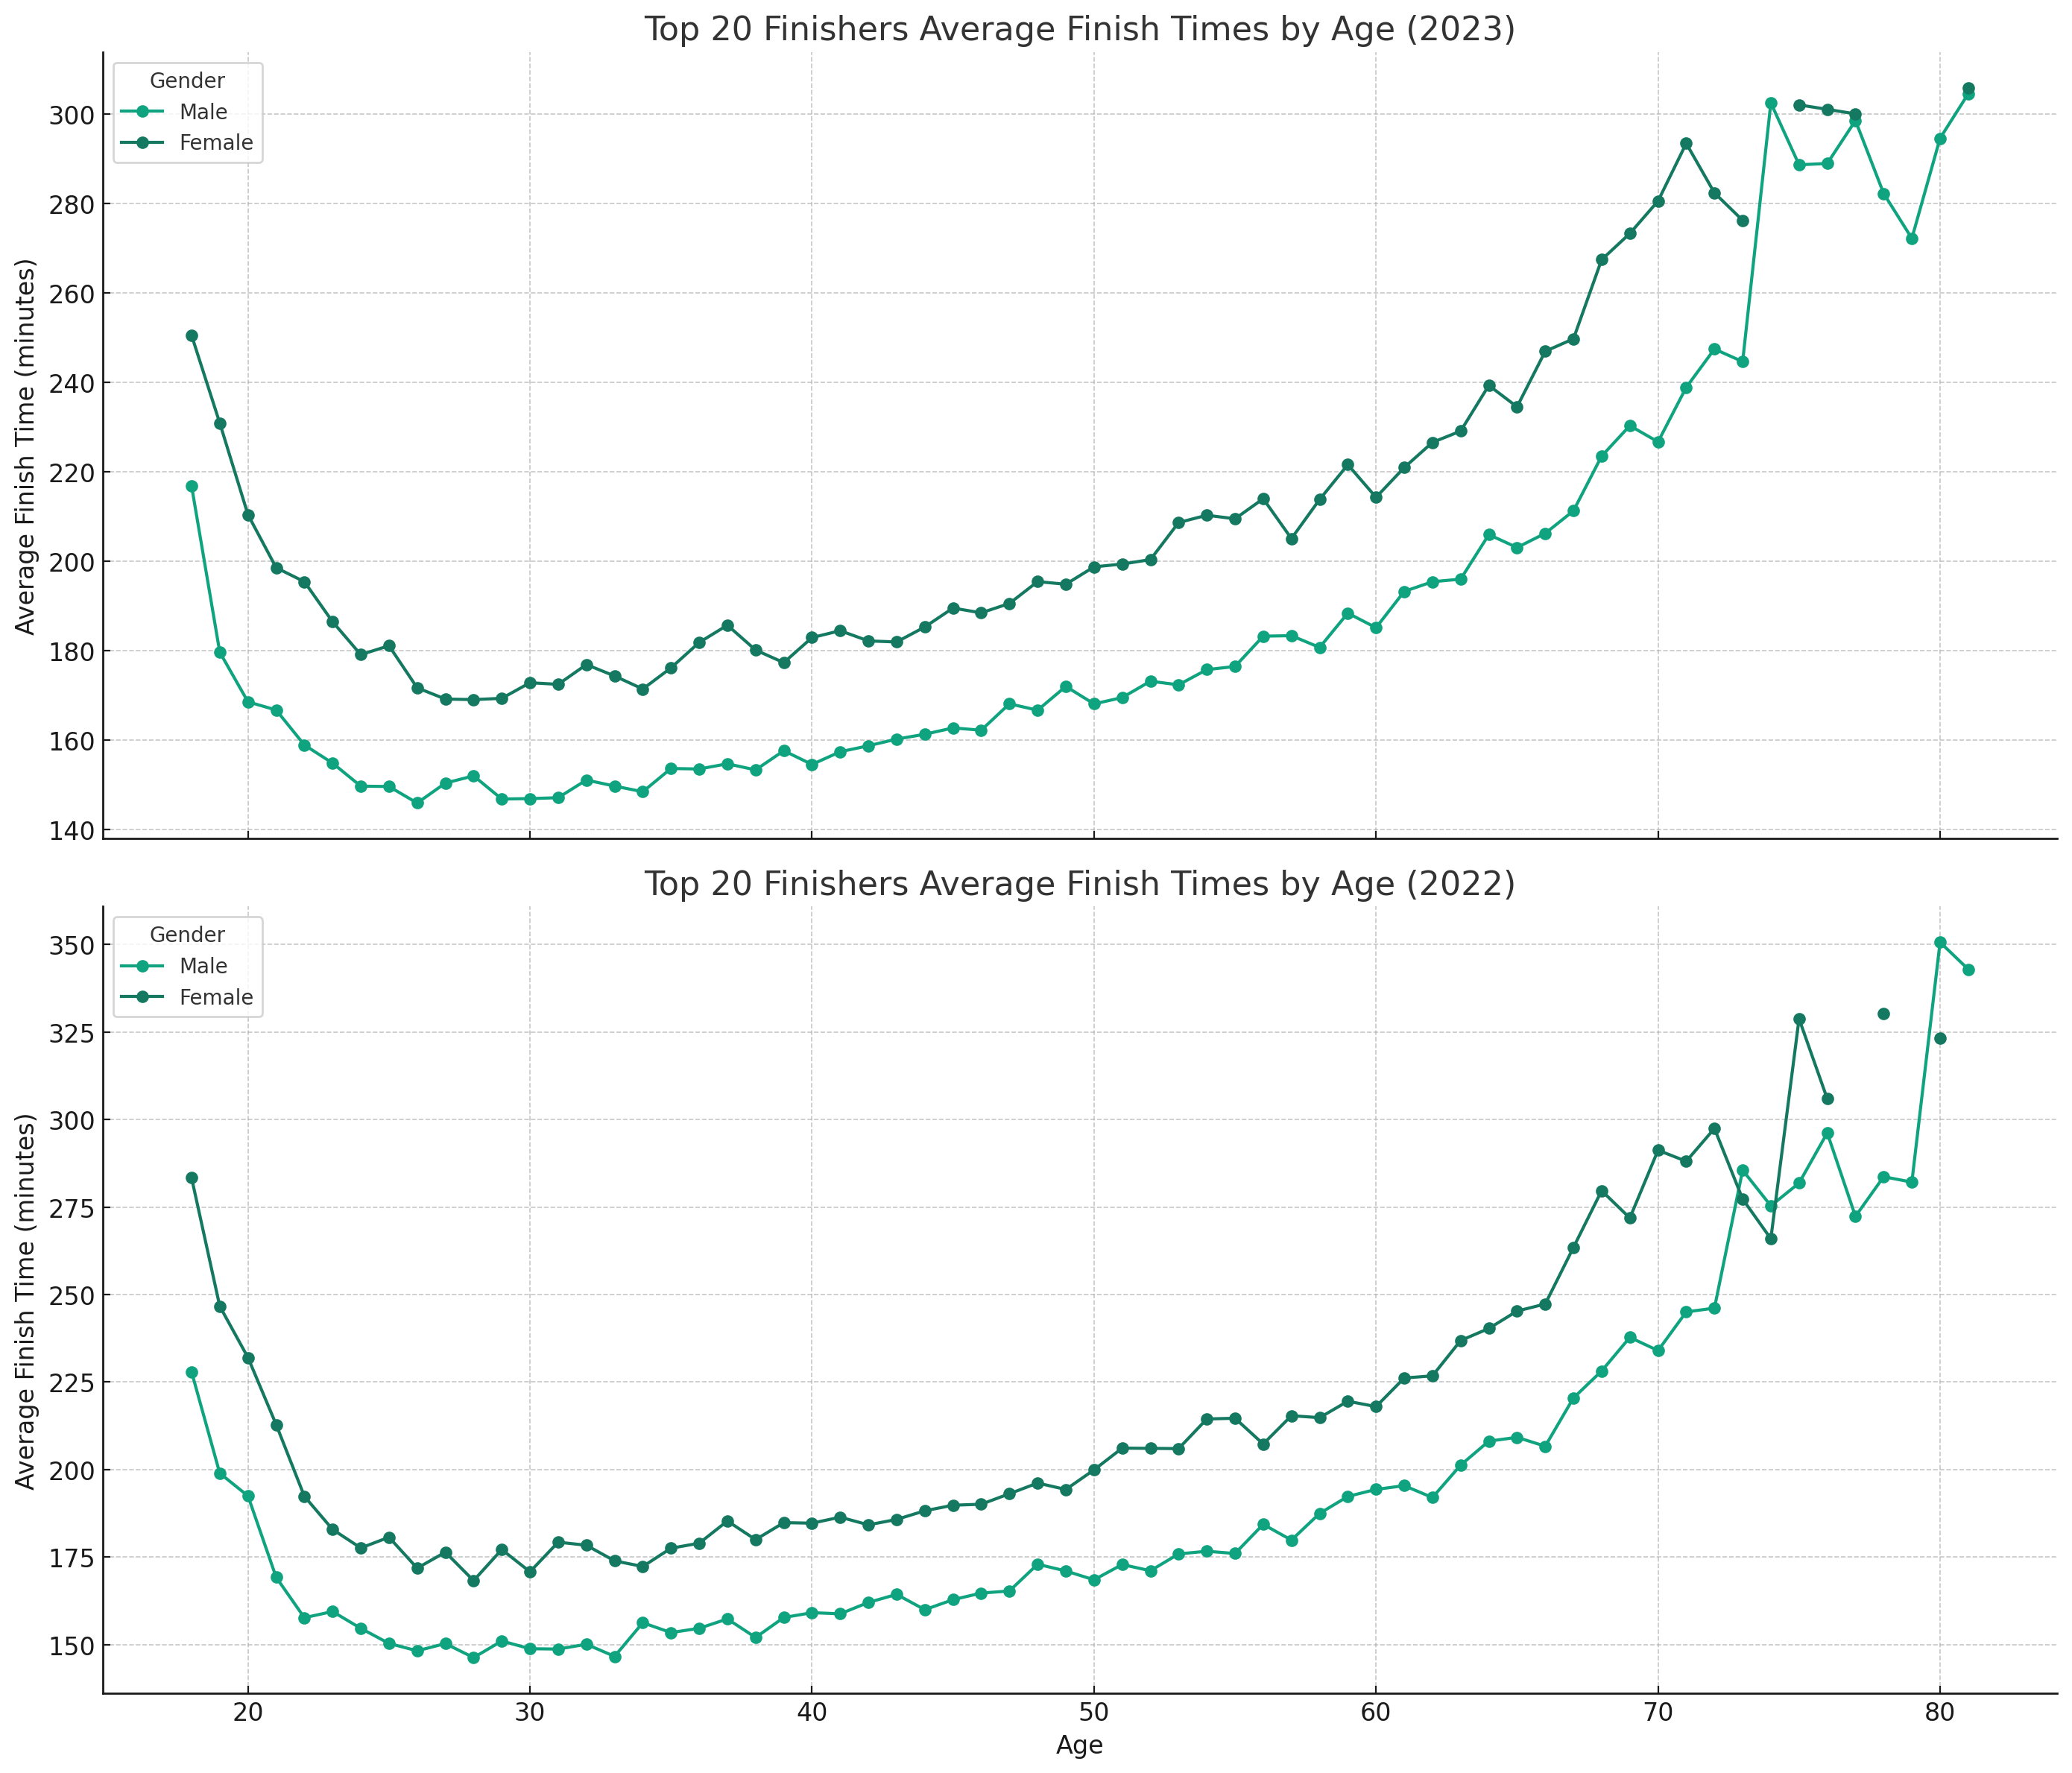
9. What is the perfect age to run a marathon?
In order to answer this question we can look at the plots below. The plots displays the average finish times of the top 20 runners at each age. We can conclude that roughly between the age of 25 to 35, males and females run their fastest times. After that age the line clearly starts to rise indicating a decline in pace.
This plot also enables runners to calculate what average decline is ‘reasonable’.
Example: the fastest women age group (25-35) could run the marathon in 175 minutes. The fastest 50 year old women could do it in 200. That is a 25 minute decline, purely based on the fact of getting older. So, if you are a 50 year old female, you’re ‘entitled’ to adjust your marathon time with 25 minutes, compared to your 35 year old you.
We could do the same trick if we want women back their disadvantage for having less strenght than man. If you want to compare you performance with a male, you could then correct your score with the difference between the 2 lines, which is also around 25 minutes.
10. Does Age influence Pace and Decay during a race
In simple terms I want to know what effect age has during a race.
- Negative Correlation with Pace: There is a consistent negative correlation between age and average pace at all checkpoints for both years, which implies that older runners generally have slower paces. This trend strengthens slightly as the race progresses.
- Positive Correlation with Standard Deviation (STD): In both years, there’s a positive correlation between age and the standard deviation at checkpoints, starting very weakly at earlier checkpoints and increasing towards the end. This suggests that older runners might show more variability in their pace as the race progresses.
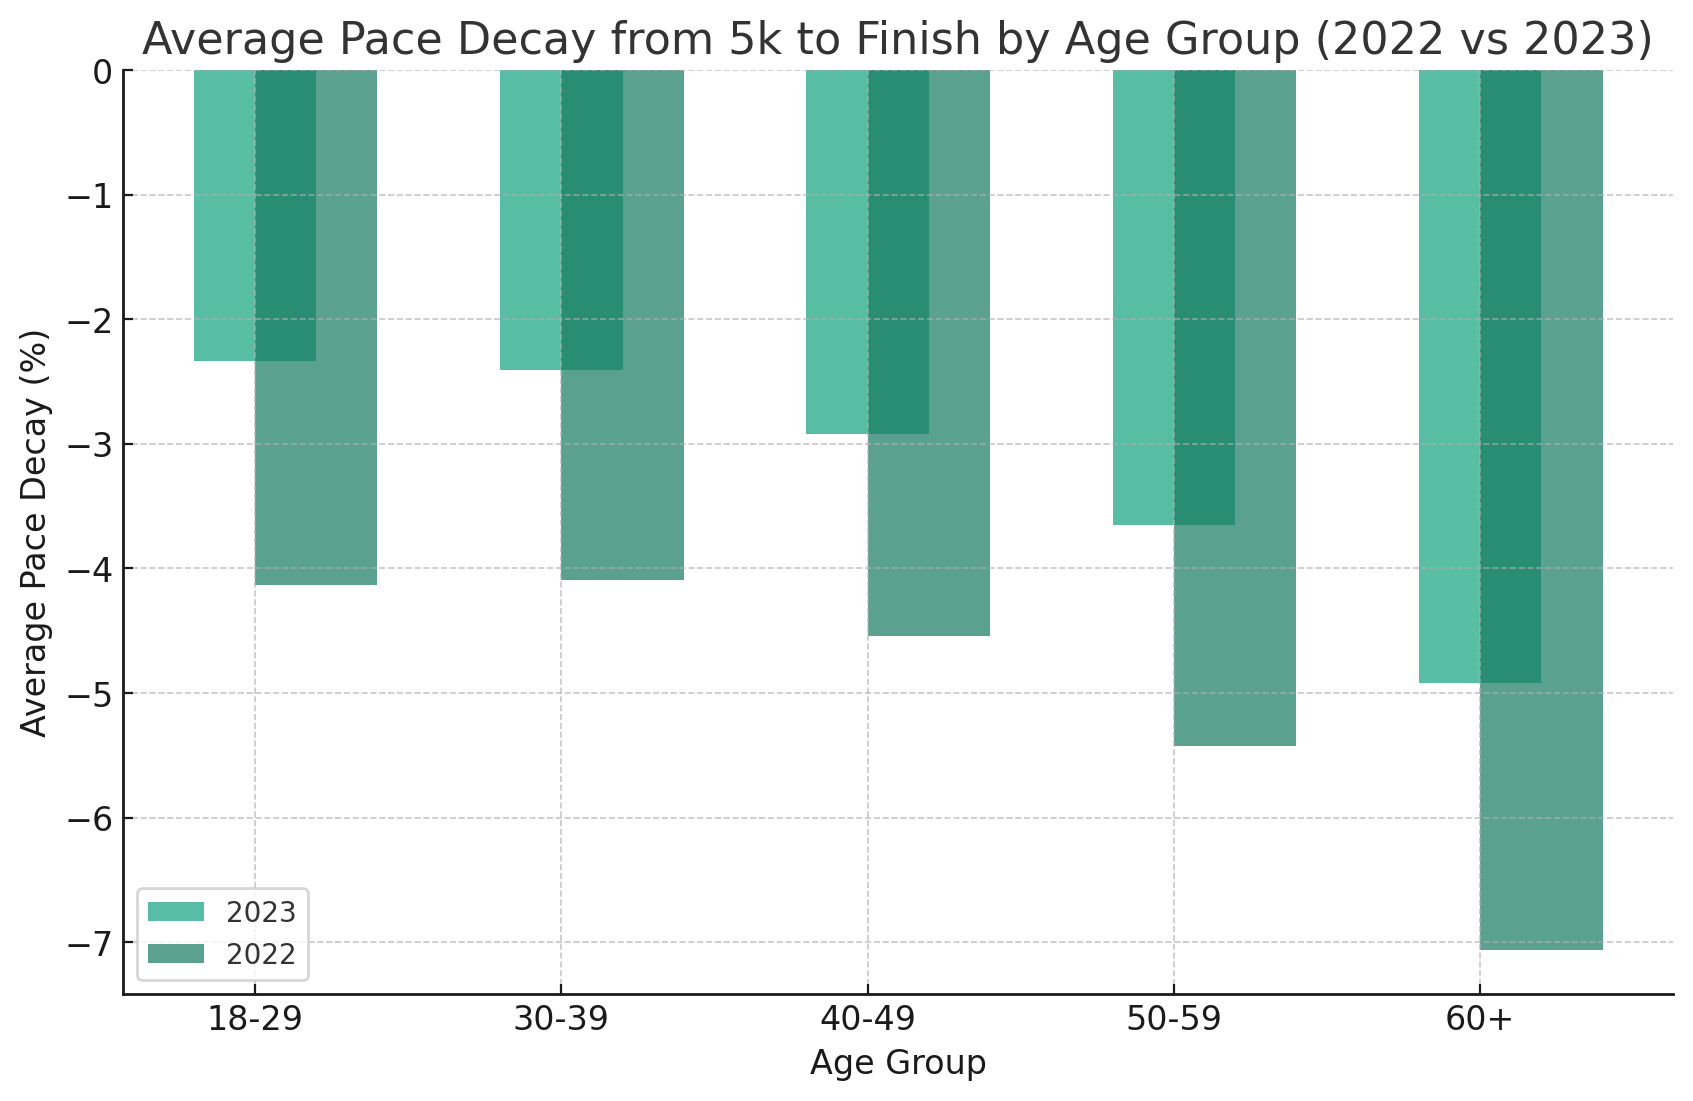
11. Average Pace Decay by Age Group
This final plot shows the average pace decay from 5k to the finish line by age group for the 2022 and 2023 Boston Marathons. This visualization helps compare how pace decay differs across age groups between the two years.
Conclusion is that pace decline is small in the younger years of a runner (2-4%) and might go up to 5-7% for older runners. In order words, the pace a runner has at the 5k checkpoint may decline from 2% to 7% depending on the age.
Conclusion
In this blog post, I have done a data cleaning and analysis exercise of the Boston Marathon 2022 and 2023 edition. My goal was to give insights into the elements that can influence a runner’s performance, like age, gender, pace and decay during the race.
Many plots will not be so surprising, but some provide information that is not readily available. Examples are the comparison of two marathons in different years, or plots that explain to what extend age influences the runner’s pace or decay during the race. I also concluded that the ‘ideal age’ to run a fast marathon is between 25 and 35. On top of that I noted that women due to their strength have a disadvantage over men of about 25 minutes. This difference doesn’t change over time.
Next blog regarding the Boston Marathon covers the prediction of finish times during the race by using Machine Learning. If you’re interested in this topic as well, please click this link:
Thanks for reading my blog. Nick.
The coding I’ve done (in VS Code)
Check out the code of this project on Github (sweetviz part): Nick Analytics – Credit Card Fraud pt. 1


