Gap Strategy with Stocks
Welcome to this new post about my Data Analytics journey.
As a stock market enthusiast I tried out many strategies to make a profit with technical analysis and data predictions. Most of them failed, because the stock market is basically unpredictable. And we as humans are impatient and want cash in on our profits as fast as we can.
One interesting thing I found during my ventures on the stock market, was the phenomenon of ‘gaps’ in the stock price. I didn’t know they existed or were relevant, until I glared at my screen for hours and found a repeating pattern of gaps opening and closing.
I decided to do my own investigation. I collected data, did some statistical analysis and came up with a strategy. Let’s see how this played out.
Introduction to Gaps
Let me first explain what Gaps are:
Gaps are areas where a stock’s price jumps sharply from one level to another without much trading in between. These gaps often occur due to after-hours news or events that cause a sudden increase in buying or selling pressure.
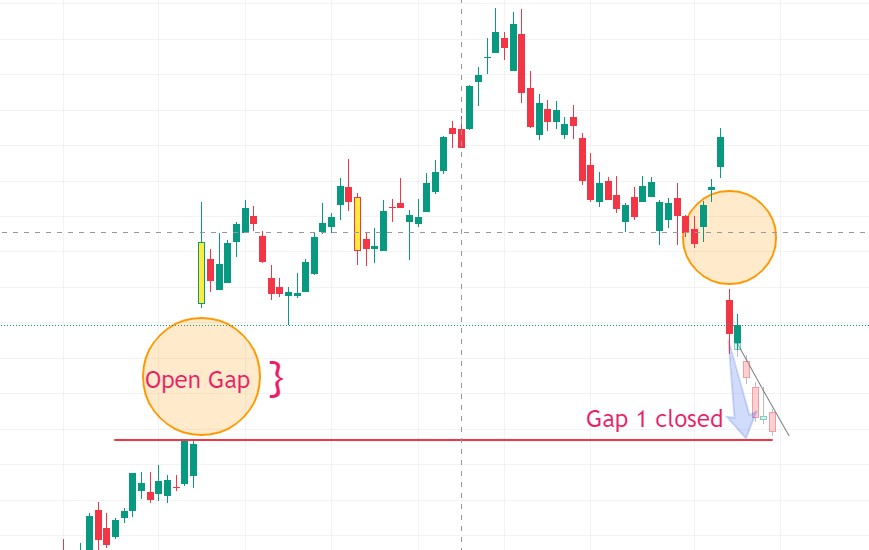
Gaps are clearly visible on stock charts when the candle view is chosen:
Disney (DIS) chart Feb-Apr 2024 (in days).
What happened here?
On the chart an Open Gap is formed on the left. Price jumped up from one day to the next leaving a large gap (price difference) between the previous top and the next bottom of the candles. This is called a gap, or a ‘price inbalance’. The general belief in the market is that gaps act as ‘magnets’ that want to draw the price of the stock back to the point where the gap started, thus creating a ‘Gap Close’ and restoring the balance.
After the Gap came about we see the plot continue to rise, but some weeks later a price fall sets in and now the ideal target would be the point where the gap has closed. And yes, we see the chart move in that direction.
Same day gap closes
A ‘same day gap close’ happens when the stock price leaves a gap at the opening, but that gap is closed or filled that same day. This is a phenomenon we see happening over and over again. And not just on daily charts. It is can be viewed on weekly, hourly or minute charts as well.
Developing the ‘Gap Dashboard’
It is not so easy to watch charts for gaps and come up with a workable strategy. That is why I created a Streamlit dashboard that allows users to select a ticker, define a date range, and analyze the gaps for that particular stock. The dashboard utilizes Python’s yfinance library to fetch historical stock data and pandas for data manipulation. In order to create a nice front-end I used the python library Streamlit.
Steps and Features
Here are the key features and steps I integrated into the dashboard:
- Setting Up the Environment:
-
- The Streamlit dashboard is set up with a configuration that includes custom CSS for styling, ensuring a user-friendly interface.
-
- Ticker and Date Selection:
-
- Users can select from a predefined list of tickers and specify how many years ago they want to analyze, using a slider for the date range. This flexibility allows for dynamic analysis over different periods.
-
- Data Fetching and Processing:
-
- The application fetches data from Yahoo Finance using the
yfinancelibrary. Data such as opening, high, low, and closing prices are retrieved and processed. - The dates are localized to ensure consistency in the data.
- The application fetches data from Yahoo Finance using the
-
- Gap Detection Algorithm:
-
- The dashboard identifies two types of gaps: True Gaps and Same Day Closes. True gaps are where the stock does not return to its previous day’s range in the next session, while same day closes are gaps that return to the previous day’s range within the same trading day.
-
- Visualization and Metrics:
-
- My application provides a visual representation of gaps and a detailed breakdown of each type, including the size of the gaps and their dates.
- Additional metrics such as the nearest gap, mean gap size, and correlations between gap size and duration are calculated and displayed.
-
- Interactive Charts and Data Tables:
-
- A line chart showing the stock’s closing prices over the selected date range helps users visually identify the gaps.
- Interactive data tables display the list of identified gaps, providing a clear and actionable insight into the gap analysis.
-
Impression of the result
Two strategy examples (for educational use only)
I have defined two strategies that may succesfully play the Gap:
– first one is to go for the ‘same day gap close‘.
– second one is to evaluate a gap that hasn’t closed the same day and use statistics to make your ‘bet’.
Same day Gap Close Strategy
In the Dashboard I visualized how many same day closes there were in the selected timeframe (2,5 years for Microsoft):
MSFT Same Day Gap Closes in the last 2,5 years
It is pretty impressive to know that almost 71% of all gaps that occur close the same day. If you play this consistenly you may have a pretty high chance of success.
Strategy for multiple day gaps
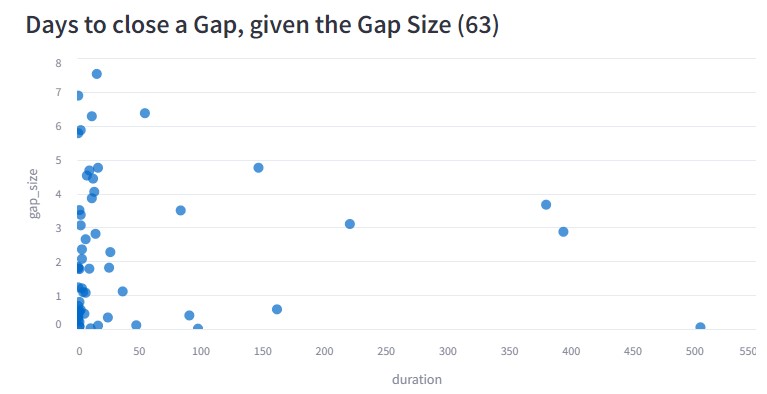
Gaps that last longer than 1 day need some more metrics to make a calculated guess if the gap will be closed any time soon. One nice plot I created is the “Days to close a Gap, given the Gap Size”. I want to know if larger gaps take more time to close. In order to check that I created 2 visuals:
– First Visual: The Correlation between gap_size and duration
This metric gives and indication if smaller size gaps take less time, and larger size gaps take more time to close. For Microsoft the outcome was:
This means that for MSFT there is barely any relationship between gap_size and its duration.
– Second Visual: A Scatter plot showing the gap_size with duration.
Indicated below is the chart of MSFT (april 2024).

This plot indicates that from the 63 multiple day gap closes, 52 closed roughly within 30 days. The other 11 are more or less outliers where the closure could take up to 500 days in this example.
So, knowing that there is no relationship between size and duration, and knowing that 80% of the multi day gaps of MSFT closed within 30 days, we can formulate a strategy. This strategy could be to wait for the market to start moving into the direction of the gap and then buy or sell those stocks.
*** Note: the 2 strategies I described above do not serve as advice, but only for educational purposes.
Check out my dashboard
My dashboard can be found on this link: Nick Analytics Dashboard or press the button:
Conclusion
In this blog post, I have explored the steps of analyzing Gaps in stock prices. I created a Streamlit Dashboard that can display the gaps and point to trading opportunities. I added statistics to back up the decision making process.
Thanks for reading my blog.
The coding I’ve done (in VS Code)
Check out the code of this project on Github: Gap Detection in Stocks


